
Guides Progress & rankings
Progress & rankings
Where to find your numbers, what they mean, and why an hour of walking is worth more XP than you'd expect.
Your home dashboard #
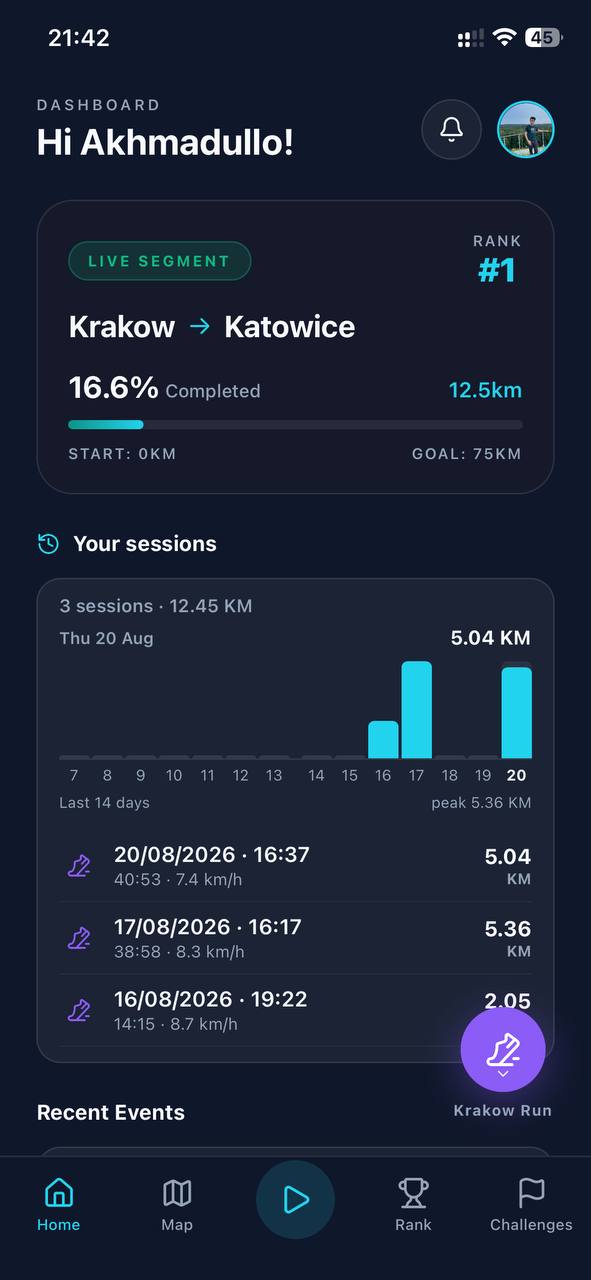
The Home tab is the quick answer to “where am I up to?”
- Live Segment — the race you're in, the route, how much of it you've completed, and your current rank.
- Your sessions — the last 14 days as a small chart, plus your recent recordings with distance, duration and average speed.
- Recent Events — who's just ahead of you, who you're ahead of, and milestones you've hit.
Performance: your numbers #
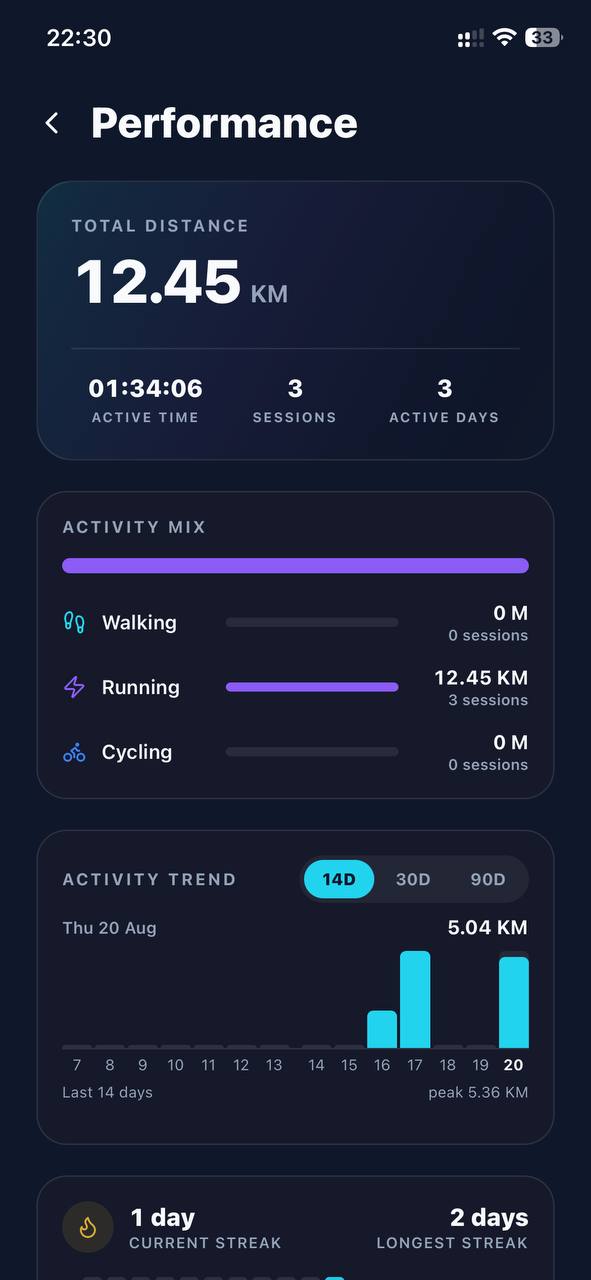
Open Profile → Performance for the full picture of what you've done.
- Total distance, active time, number of sessions and active days.
- Activity mix — how your distance splits across walking, running and cycling.
- Activity trend — a bar chart over the last 14, 30 or 90 days.
- Lifetime distance — everything you've ever recorded, solo sessions included.
Streaks and personal records #
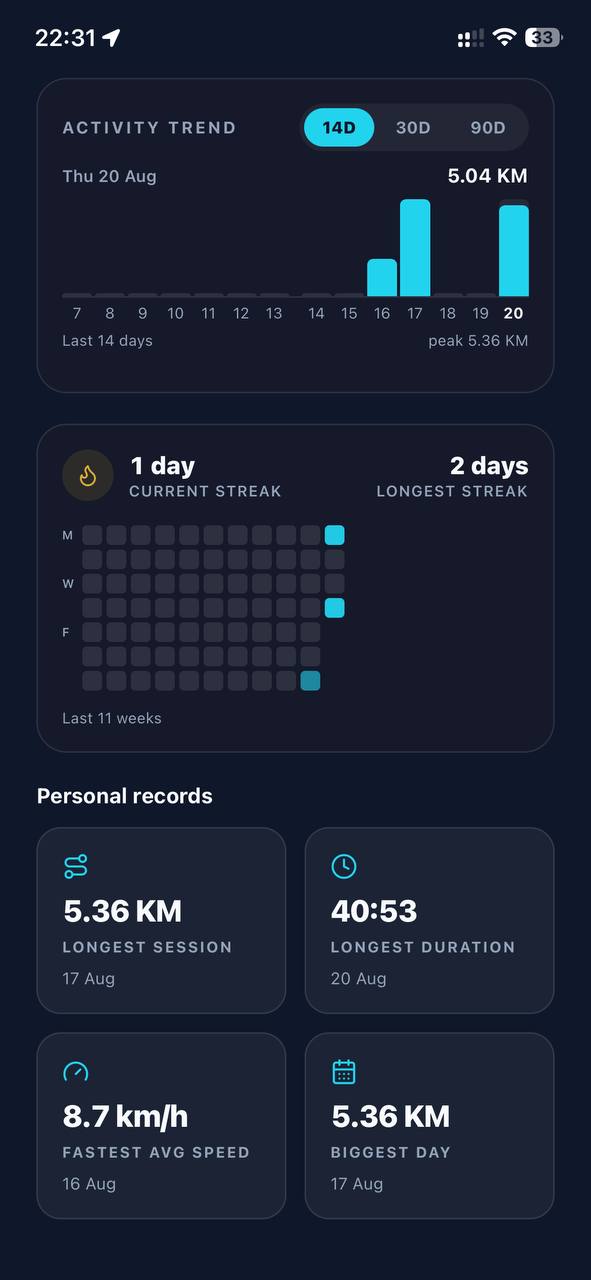
The consistency heatmap shows the last 11 weeks, one square per day, so you can see your habit rather than just your totals. Alongside it are your current streak and your longest ever.
DerbyOn also keeps four personal records automatically:
- Longest session — furthest single recording.
- Longest duration — most time in one session.
- Fastest average speed — your quickest session overall.
- Biggest day — most distance covered in a single day.
XP, levels and tiers #
XP is DerbyOn's measure of effort, and it's the one number that goes up no matter what you're doing — racing or not, winning or not.
XP is about effort, not distance
This matters, and it's a deliberate choice. XP is calculated from how hard the activity is and how long you did it for, not from raw kilometres. An hour of brisk walking and an hour of easy cycling cost your body roughly the same, so they earn roughly the same. An hour of running costs about twice as much, and earns about twice as much.
The practical upshot: walkers are not second-class citizens here. You don't have to run to make progress.
Levels
Your level comes from your total XP, and each level takes a little more than the last: level 2 at 25 XP, level 5 at 400, level 10 at about 2,000. You'll see a Level Up! message when you cross one.
Tiers
Six tiers sit on top of levels as a shorthand for how far you've come:
| Tier | Total XP |
|---|---|
| 🌱 Rookie | 0 |
| 🚶 Strider | 100 |
| 🏃 Pacer | 300 |
| 🔥 Athlete | 700 |
| 🏆 Champion | 1,500 |
| 👑 Legend | 3,000 |
These are spaced to be a long climb on purpose. Someone doing about five hours of moderate activity a week reaches 1,000 XP in roughly six months, so a high tier means something.
Leaderboards #
The Rank tab has two views:
- This challenge — everyone in your current race, by distance and progress, with finishers at the top.
- Global ranks — every DerbyOn athlete by total XP, with their level and tier.
Your own row is marked YOU. Your profile also shows your global rank and your standing as a percentage — “Top 5%” and so on.
For exactly how challenge positions are decided, see how the standings are ranked.
The map, three ways #
The Map tab has three lenses, switched at the top.
| Lens | What it shows |
|---|---|
| Live | Your position on the route right now, how far is left, nearby rivals and your rank. If you're not in a race, it just shows where you are. |
| Replay | Any finished session, redrawn as the route you actually took. |
| Territory | A heatmap of everywhere you've ever recorded — your accumulated ground. |
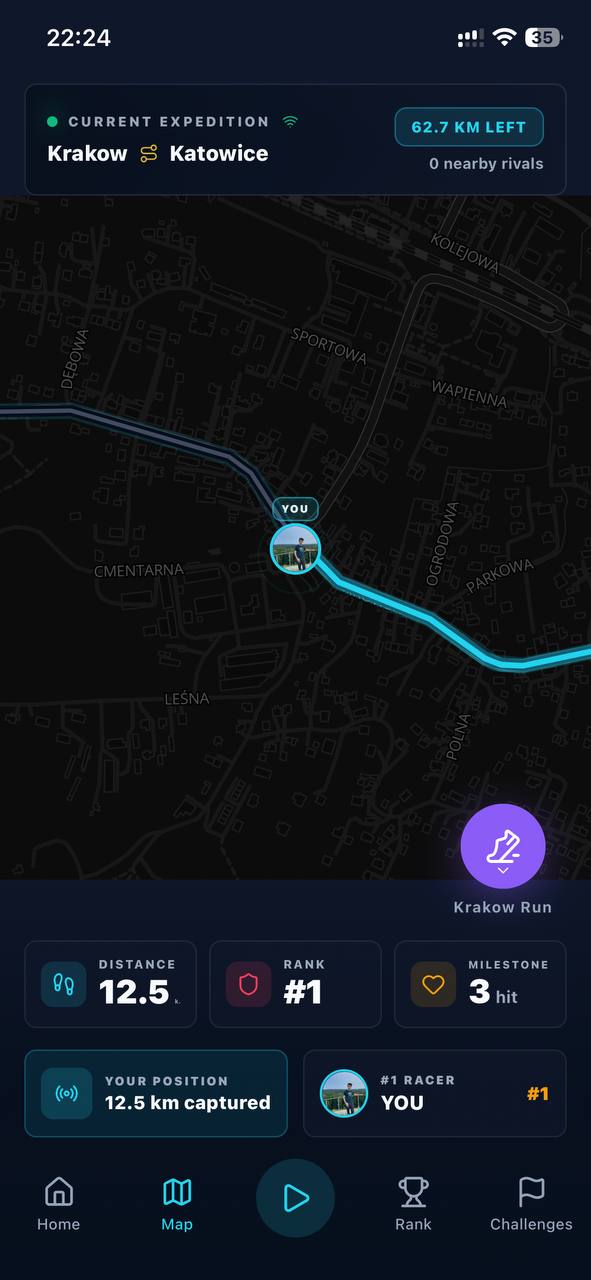
During a race the map also shows checkpoints at 25%, 50% and 75% of the route, and labels rivals by where they sit relative to you — race leader, nearest ahead, close behind.